Imagine your Blueprinting team has completed Step 4: Side-by-side Testing, and is now ready for Step 5: Product Objectives. Many teams have insufficient data at this point, and resort to guesswork. You have the opposite problem: You’ve got a “gusher” of data to deal with. These four tips will help…
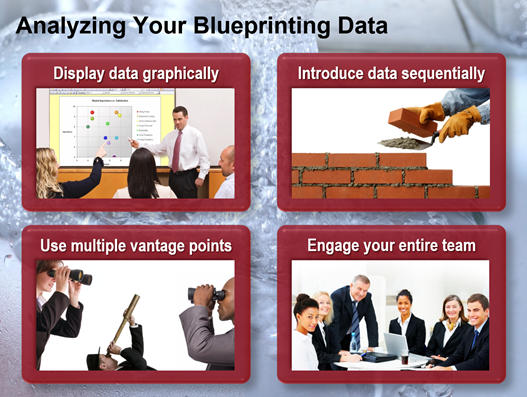
- Display data graphically. This allows the human brain to process much more information.
- Introduce data sequentially. Systematically add new information like courses of brick to strengthen your understanding. If you do a data dump, you’ll confuse everyone.
- Use multiple vantage points. Any single formula or chart that gives you “the answer” will be neat, easy-to-use… and probably wrong.
- Engage your entire team. Everyone who worked to gather the data should have a voice in this.
The good news is that Blueprinter software takes care of the first three points above. Based on all the work you’ve done to-date, Blueprinter will automatically populate a series of charts. All you do is get your team in that conference room with a projector. Bring in some food, lock the door, and create a great new product design.
Blueprinter software provides your team with a total of 8 charts, as shown below. To begin with, your team will look at 6 charts for analyzing data and developing strategy. Then you’ll look at 2 charts for creating a product design… one for your next new product, and an optional chart if you want to develop a roadmap of future products…
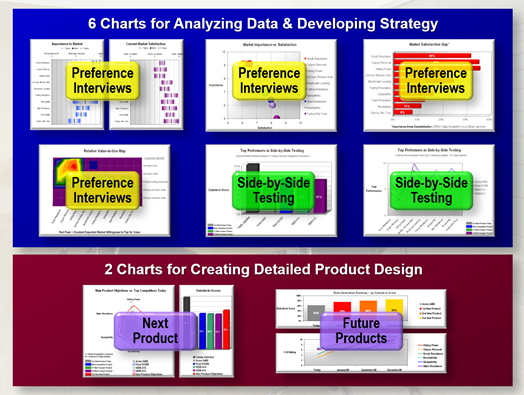
Here's a brief description of these charts:
- IMP+SAT: Helps you define a “tight” definition of your market segment. Data comes from your Preference interviews, and the chart is found in cloud-based Blueprinter Tool 3.6.
- Bubbles: Helps you target outcomes to pursue and spot must-haves (upper-right). Data comes from your Preference interviews, and the chart is found in cloud-based Blueprinter Tool 3.6.
- Market Satisfaction Gaps: Helps you decide which outcomes to pursue. Data comes from your Preference interviews, and the chart is found in cloud-based Blueprinter Tool 3.6.
- Outcome Value Heatmap: Explains the benefits customers would receive. Data comes from your Preference interviews, and the chart is found in cloud-based Blueprinter Tool 3.6.
- Outside-In Chart: Shows the attractiveness of competing products. Data comes from your Side-by-side Testing, and the chart is found in Excel-based Blueprinter Step 5 (today).
- Competitive Performance: Shows competitors performance for each outcome. Data comes from your Side-by-side Testing, and the chart is found in Excel-based Blueprinter Step 5 (today).
- Product Design: Let’s you do “what-if” product designs to see how they compare to competitive offerings. The chart is found in Excel-based Blueprinter Step 5 (today).
- Multi-generational Roadmap: Let’s you create and display two additional “next-generation” product designs. The chart is found in Excel-based Blueprinter Step 5 (today).
Before your team begins this work, it’s a good idea to review e-Learning Module 27: Product Objectives (at www.blueprintingcenter.com > e-Learning Modules.)
Keywords: Blueprinting Step 5: Product Objectives, product design, analyze Blueprinting data, develop new product strategy, create new product design