After reviewing the six Blueprinter charts generated by your Preference interviews and Side-by-side Testing (last article), it’s time to create your new product design. Today, this is done in Excel-based Blueprinter Step 5.
Begin in Step 5.2. In column 3 (green border below), assign a 1-through-10 number to each outcome. This is only used to determine which outcomes will display on your 6-point radar chart, and which position the outcomes take. The outcome you assign the #1 position to will be at 12 o’clock, and #2-6 outcomes will be arranged clockwise from there. Many teams simply give the #1 position to the highest Market Satisfaction Gap outcome, with numbers descending after this. But if there’s an outcome you don’t wish to display, for instance, simply don’t assign a number (or make it #7-10).
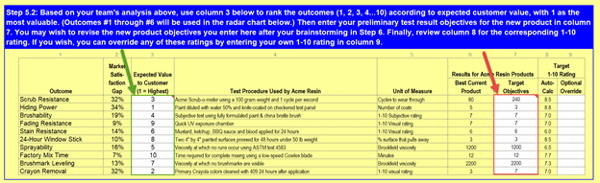
Next, your team will make entries in column 7 (red border above). These are the actual test values you’ll aspire to achieve when you develop your new product. You’ll see the 1-to-10 satisfaction rating in column 8 that results from your column 7 entries. There’s no point in targeting test values beyond whatever generates a satisfaction of 10… because customers are “totally satisfied” at this point.
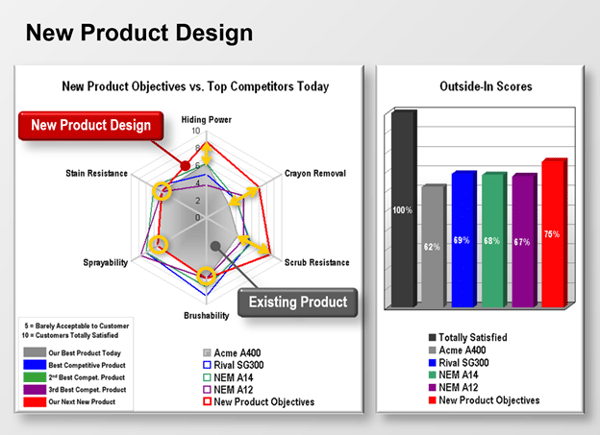
After you enter your target test values, you can see how good your new product design looks. Just scroll down to Step 5.4 and you’ll see a radar chart on the left and an Outside-In chart on the right:
Radar chart: If you tested an existing product of yours, it will display as a grey area. Your top 3 competitors will display as blue, green and purple lines. And the new product design you just created in Step 5.2 above displays as a red line. In the example below, the team decided to not improve the outcomes, Stain Resistance, Sprayability, and Brushability (yellow circles). And it decided to improve the outcomes, Hiding Power, Crayon Removal, and Scrub Resistance (yellow arrows).
Outside-In Chart: How would this market view your “red-line” product design shown in the radar chart? Their likely overall satisfaction is represented by the red column in the Outside-In chart on the right. In the example below, the new design would be viewed more favorably than the teams’ existing product and its competitors’ products.
Of course, just because your team wants to create a certain design, doesn’t mean it will succeed in the development stage. Most teams return to Step 5: Product Objectives after spending some time in Step 6: Technical Brainstorming. This allows a back-and-forth exchange between what you want to do and what you can do.
For more on setting new product objectives, see e-Learning Module 27: Product Objectives (at www.blueprintingcenter.com > e-Learning Modules.)
Keywords: Blueprinting Step 5: Product Objectives, product design, analyze Blueprinting data, develop new product strategy, create new product design, radar chart, Outside-In chart