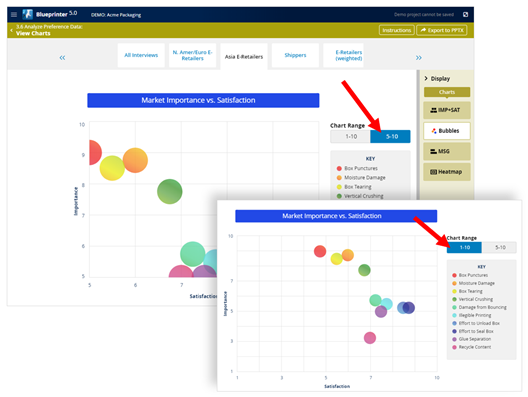
After carefully defining and refining your Market Views (last two articles), it’s time to examine the Bubble charts in Blueprinter Tool 3.6: Analyze Preference Data. Just click on the Market View of interest (top row in screen below) and “Bubbles” on the right side.
Notice the default chart range is 5-to-10 for both the vertical “Importance” Axis and horizontal “Satisfaction” axis. That’s because it’s common for all outcomes to be in this range. But in the example below, you’ll see the red bubble (for the outcome, “Box Puncture”) is only a half-circle. That’s your clue that this outcome probably had a market-averaged Satisfaction rating below 5. To check, click the blue “1-10” button instead of “1-5” (red arrows below) and you’ll see the full range on both axes.
So how can your team use this chart to plan its product design? Here are three strategies:
- High-eagerness outcomes: Look for outcomes in the upper-left of the chart… those that are both important and currently unsatisfied. These are outcomes your market segment will be eager for you to improve… and the only outcomes customers might pay you a premium for. Those farthest in the upper left will have the highest Market Satisfaction Gaps (next chart) and will be top candidates for your team to focus on with its new-product design.
- Must-Have outcomes: What if a bubble is in the upper-right? This outcome is very important to customers, and they are already satisfied with it… and therefore it will not register a high Market Satisfaction Gap (next chart). A common error is to focus just on high Market Satisfaction Gaps… but if you ignore this type of outcome, your new product design could fail.
- Cost-reduction candidate: Suppose you have an outcome that is at the bottom of your chart: It’s not important to this market. This could be a good opportunity to create a new product design that does not satisfy this outcome… especially if it lets you take cost out of your new product.
For more on analyzing Preference interview data, see e-Module 24: Preference Interviews B, at www.blueprintingcenter.com > e-Learning. For research on how AIM clients conduct Preference interviews, download Preference Interview Research Report.
Keywords: Blueprinter 3.6: Analyze Preference Data, Bubble chart, Market View, market sub-segment, analyze Preference interview data, sub-segment by region, sub-segment by point in value chain, sub-segment by business model, analyze Market View charts, high-eagerness outcomes, Must Have outcomes, cost-reduction candidates