The New Product Blueprinting process includes some unique—and powerful—ways to manage your test data. Today this is done in Excel-based Blueprinter 4.0 Step 4… but in the future it will move to our cloud-based Blueprinter platform. For a complete discussion of how the data is managed, please view e-Learning Module 25: Side-by-Side Testing.
For now, here are the six principles used for processing your test data:
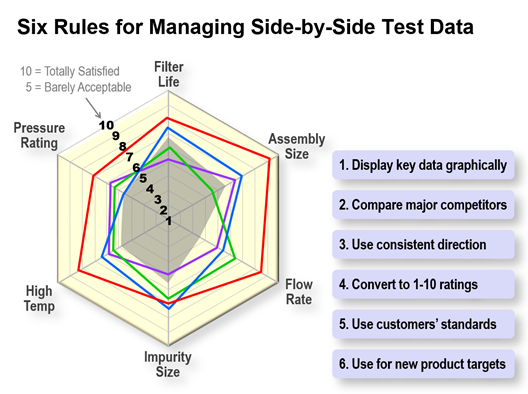
- Display key data graphically: This is the most powerful way to gain insights. In the chart below, you’ll see six key outcomes displayed for a fuel filter example.
- Compare major competitors: It helps to look at your customer alternatives at the same time in the same way. Blueprinter software displays the top competitor in blue, followed by the second-best in green and then purple. If you have also tested some of your own existing, off-the-shelf products, the best one shows up as a grey area.
- Use consistent direction: Have you ever seen a radar chart where “good” for one outcome is on the chart’s outside ring, and “good” for another is in the chart center? Very hard to mentally process, right? Blueprinting methodology always has “good” on the outside. For Filter Life, high results are good because the more hours the filter operates without clogging, the better. But for Assembly Size, low results are good: The smaller the filter size—in terms of cubic centimeters—the happier the customer will be.
- Convert to 1-10 results: The best way to get the most information on a single chart is to convert all test results to 1-10 ratings. So instead of trying to display hours of filter life and cubic centimeters of assembly size, all data is displayed on a 1-10 scale.
- Use customers’ standards: In the above conversion of test results to 1-to-10 scales, we’ll use the customers’ standards for doing this. During Preference Interviews, you defined a 10 as “Totally Satisfied” and a 5 as “Barely Acceptable”… and asked customers for test method information using these same terms. So anyone familiar with Blueprinter charts will instantly be able to interpret one… knowing that the scale can’t be “gamed” to get certain results.
- Use for new product targets: Finally, you’ll use this same chart when your team plans its new product targets. Your design target will always be displayed in red.
The conversion of your test data into 1-to-10 scores is no trivial matter. Fortunately, your Blueprinter software does this for you. If you’d like to learn how it does this, please go to www.blueprintingcenter.com > e-Learning Modules > e-Learning Module 25: Side-by-side Testing.
Keywords: Blueprinting Step 4, side-by-side testing, side by side testing, competitive testing, competitive benchmarking, customer alternative, competitive offering, competing product, manage test data, process test data,