Let’s say your team is meeting every two weeks to update progress on CheckPoint tasks and to record the entries described in the last article. Before the team leaves each meeting, it’s a good practice to review overall progress. As indicated in the numbered notes in the illustration below, your team looks at the following:
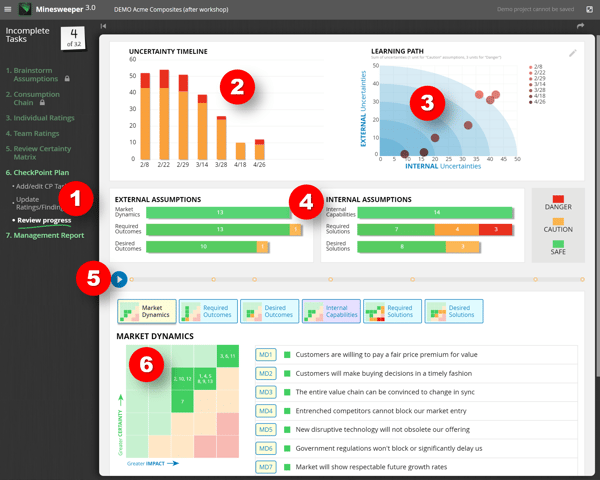
- ‘Review Progress’ page: Begin by clicking Step 6: CheckPoint Plan > Review Progress. This displays several views, all of which you can include in your reports to management.
- ‘Uncertainty Timeline’ Chart: This column chart shows the number of red Danger and yellow Caution assumptions your team is dealing with at different points in time. It’s not at all uncommon to see the columns increase initially: This indicates your team is open to adding more assumptions as it learns from others outside your team… a very good thing. But eventually you hope to see the number of red and yellow assumptions decreasing, as shown here.
- ‘Learning Path’ Chart: This bubble chart applies one unit for every yellow Caution assumption and three for every red Danger assumption. It plots your project’s position on this chart with a different bubble for each point in time. The vertical axis includes external factors generally outside your control: Market Dynamics, Customer Required Outcomes, and Customer Desired Outcomes. The horizontal axis tracks internal factors potentially within your control: Internal Capabilities, Required Solutions, and Desired Solutions.
- ‘External and Internal Assumptions” Chart: This bar chart displays the number of green, yellow and red assumptions for the current point in time. As your project progresses, you’ll expect most of the assumptions to “convert” from red and yellow to green.
- Timeline: This is the fun part for most teams. Press the blue arrow and you’ll see all three charts change to reflect your team’s progress over time: The gold circles on this timeline reflect updates your team has made in the software. If your project has progressed far enough, you’ll see the columns getting shorter in the Uncertainty Timeline... the bubbles moving to the lower left in the Learning Path... and red and yellow assumptions converting to green in the Assumptions bar charts.
- Certainty Matrices: Here you can click any of the six certainty matrices to quickly see the status of all your assumptions. To make changes in their impact and certainty ratings, you simply click the assumption note in this view.
Keywords: Review progress, review project, progress charts, Uncertainty Timeline, Learning Path, bubble chart, External Assumptions, Internal Assumptions, Certainty Matrices