The Market Satisfaction Gap chart is the most important of the 4 charts in Blueprinter Tool 3.6: Analyze Preference Data. In fact, this chart is reproduced in your 6-part Market Case document in the last section, “Value Proposition” (generated in Blueprinter Tool 3.7: Create Market Case).
To view a Market Satisfaction Gap (MSG) chart, just go to Tool 3.6 and click the name of the Market View you are interested in. Then click the “MSG” button on the right side. You can also select any of the other Market Views by clicking them in the top row.
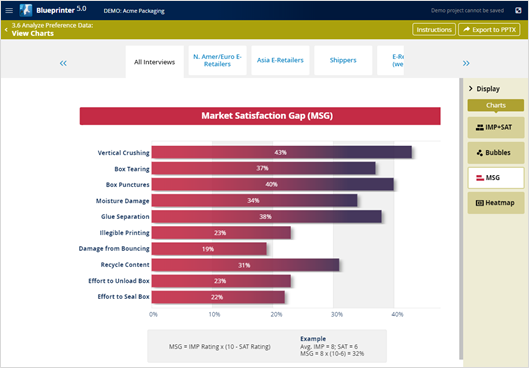
A shown in the chart above, the formula for MSG is average Market Importance rating (IMP)… multiplied by 10 minus the average Market Satisfaction rating (SAT). So if the outcome’s average IMP is 8 and average SAT is 6, MSG = 8 x (10-6) = 32%. Here are some strategies for your team to consider:
- MSG over 30%: In general, if an outcome has an MSG of approximately 30% or more, this is your indication the market is eager to see you improve it. These are the outcomes most teams focus on.
- MSG in high 20% range: We’ve seen some teams succeed by improving multiple outcomes all in the high-20% range… so don’t exclude these.
- Over-served market: If all your outcomes score in the low 20% range and below, this is an over-served market. That is, the market is satisfied with what it is getting today and only wants lower pricing… so most teams abandon these projects.
- Low-end disruption: Here’s an exception to the point above, where the market is over-served. This could be an attractive market to pursue if you have a disruptive low-end technology that allows you to offer a lower-cost product—and still make a good profit.
- Themes: Look for several outcomes you could pursue that follow a central theme. In the example above, consider resistance to vertical crushing, tearing, punctures and moisture. Your new product messaging could be all about your tough, durable packaging solution.
- Value chain target: Carefully consider which point in the value chain “calls the shots.” In this packaging example, it’s likely that the merchandise e-retailers have much more influence over packaging selection than shippers.
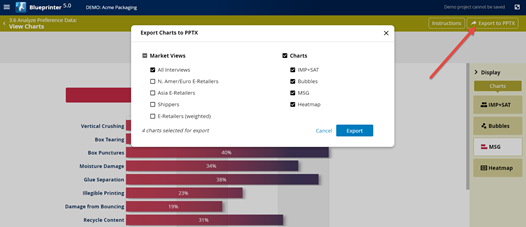
- Print PowerPoint charts: A handy way to compare various Market Views is to export your charts to PPT… and then review them in the full-slide mode. This lets you click from Market View to Market View, observing similarities and differences. To create PPT slides, just click the “Export to PPTX” button (red arrow below). A pop-up window then lets you select which Market Views and Charts you’d like to export. Once the charts are created in PPT, you can group them by chart type if you like… which helps you compare one Market View to others.
For more on analyzing Preference interview data, see e-Module 24: Preference Interviews B, at www.blueprintingcenter.com > e-Learning. For research on how AIM clients conduct Preference interviews, download Preference Interview Research Report.
Keywords: Blueprinter 3.6: Analyze Preference Data, Market Satisfaction Gap chart, MSG chart, Market View, market sub-segment, analyze Preference interview data, sub-segment by region, sub-segment by point in value chain, sub-segment by business model, analyze Market View charts, high-eagerness outcomes, over-served market, low-end disruption