Today your team can use Excel-based Blueprinter Step 4: Side-by-side testing to establish your tests, record test results, and view the calculated 1-to-10 scores for each test result. But to interpret your test data, you’ll need use Excel-based Blueprinter Step 5: Product Objectives. You can learn more about Steps 4 and 5 in e-Learning modules 25 and 27 at www.blueprintingcenter.com > e-Learning Modules.
The Blueprinter Step 5 chart shown below is driven primarily by your side-by-side testing. You may remember that you could include several of your own off-the-shelf products and several competing products in this testing. Blueprinter selects your best product for the grey column and—among the competing alternatives—the best takes the blue column, the 2nd best the green, and the 3rd best the purple.
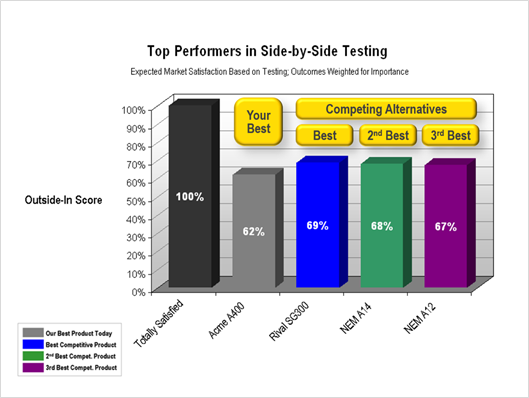
The Outside-In Score predicts how the market will view a product. So how is this Outside-In Score calculated? If a product you tested got results for all 10 Outcomes that would totally satisfy customers—that is, it scored a Satisfaction rating of 10 on all 10 tests—it would have an Outside-In Score of 100%... like the bar on the left.
Blueprinter automatically averages the side-by-side test results for your 10 Outcomes to get the Outside-In Score. But—and this is important—it doesn’t do a simple average. It gives a weighted average based on the Importance rating for each outcome. (Customers provided these ratings during Preference interviews.)
This chart gives the most customer-centric view possible of competing alternatives: Customers’ favorite outcomes… using customers’ test methods… with customers’ perspective on how good is good enough… tested against customers’ favorite alternatives… all weighted according to how important customers see each outcome. If you’re not used to seeing how customers really look at your products compared to competitors, this can be a bit shocking….like a lovely theory being attacked by a brutal gang of facts.
A natural question at this point might be, “Why did we get a 62% while this competitor got a 69%?” The next chart helps answer this question. Once again, your best product today is shown in grey, with the best competing products shown in blue, green and purple. Remember that outcomes are listed in decreasing importance from left to right.
In this case, your off-the-shelf-product’s poor performance on 2 very important Outcomes—Scrub Resistance and Crayon Removal—are really dragging down its Outside-In Score (red circles below). Also, since a rating of 5 equals “barely acceptable,” your existing product is probably unacceptable to many customers based on these 2 Outcomes.
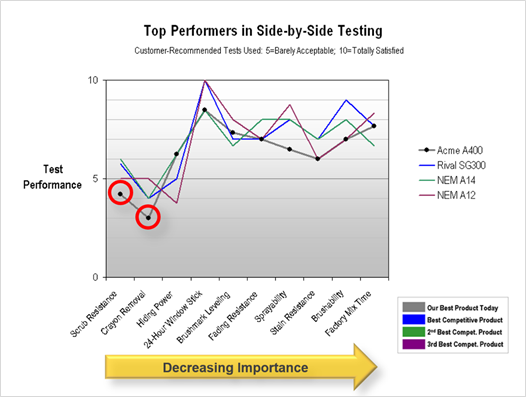
You’ll analyze both of these charts in more detail in Blueprinting Step 5: Product Objectives. But for now, you can see how your side-by-side testing will be used to help you plan your new product design.
Keywords: Blueprinting Step 4, side-by-side testing, side by side testing, competitive testing, competitive benchmarking, analyze side-by-side testing, analyze benchmarking results, Outside-In score