The Blueprinting Executive Dashboard lets your leadership team manage a portfolio of its New Product Blueprinting projects. The front-end of innovation used to be called the “fuzzy front end”… because nobody knew what was happening here. Too bad, since this leads to high commercial risk… a bigger problem than technical new product risk (a fact we've known for the last five decades!)
But if yours is a B2B company, the front-end can be the most understood part of your stage-and-gate process. Every project using Blueprinter data contains a wealth of data, such as…
- Which companies were interviewed, where in the value chain, and which job functions?
- Which outcomes do customers want improved the most? (see Market Satisfaction Gaps)
- How will customers measure our success in satisfying their key outcomes?
- How consistent and aligned is this market in its needs (using standard deviations)
Now your leadership team can have all this data—and much more—at its fingertips. Consider three options:
- Import all Blueprinter project data into your “home-grown” stage-and-gate process.
- Import this data into a third-party process, e.g. Sopheon’s Accolade® system.
- Begin using the Blueprinting Executive Dashboard (at no extra charge for Blueprinting clients).
In this article, we'll take a quick tour of the third option, your Blueprinting Executive Dashboard. (To set this up for your company--at no cost--see the BlueHelp article, How to set up your Executive Dashboard.)
There are two views--with more planned for the future: 1) Project Pipeline view and 2) Project Portfolio view. Here's a screenshot of the Project Pipeline view:
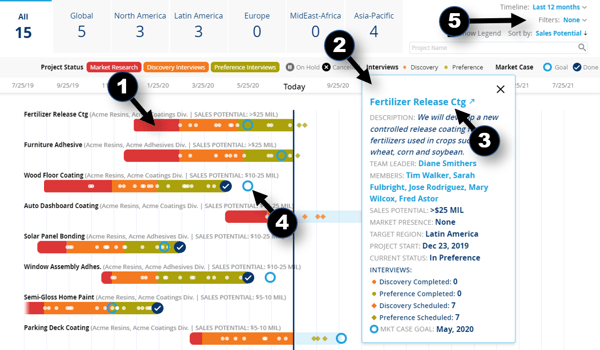
This Project Pipeline view contains the following features (as numbered above):
- The colors in each project timeline show its Blueprinting phase... red for Market Research, orange for Discovery interviews, and green for Preference interviews. The white dots represent completed interviews and diamonds to the right of the "Today" vertical timeline indicate scheduled interviews.
- Click a project timeline to see an overview panel for this project… and click the name of any team member to email that person.
- Within the project overview panel, you can click the project name to open the actual Blueprinter project for a “deeper dive.”
- A hollow blue circle indicates the team's goal for completing its Market Case. A dark blue circle with a check mark shows that Market Case has been completed.
- Filter, sort and view results in many different ways… group & division… time period… target region… sales potential… existing market presence… project start dates… and much more.
If you've already been using Blueprinter software within your company, you'll need to enter some additional data to start using the Executive Dashboard. For instance, each project needs to be assigned a Group and Division, region, sales potential, etc. See the next article to learn how to get started with this for your business: How to set up your Executive Dashboard.
Keywords: Blueprinting Executive Dashboard, portfolio of front-end projects, Blueprinter project portfolio, new product pipeline, project pipeline view, project portfolio view, leadership team, stage-and-gate, Accolade, group, division, project overview panel, deep-dive.