Imagine you want to develop a new corrugated package for e-commerce and you’ve conducted Preference interviews with e-retailers, e.g. Amazon and Zappos… as well as shipping companies down the value chain, e.g. UPS and FedEx. These interviews have taken place all around the world… and the size of merchandise being packaged varied greatly from one e-retailer to another. Here are some of the outcomes you captured 1-to-10 ratings for…
- Minimize frequency that boxes are crushed by vertical loading
- Minimize frequency that boxes are torn during delivery
- Minimize the likelihood of box damage from moisture
Can you imagine getting different 1-to-10 importance and satisfaction ratings depending on which type of interview you conducted?...
- E-retailer vs. shipper
- Asian e-retailer vs. European e-retailer
- Large merchandise vs. small merchandise
So instead of one monolithic “market segment” you might have several separate sub-segments. It’s to your advantage to understand these differences. Here’s why:
- You may need to create different package solutions for each major global region.
- You might create different package solutions depending on the size of merchandise packaged.
- For your same new product, you might promote different benefits to e-retailers vs. shippers.
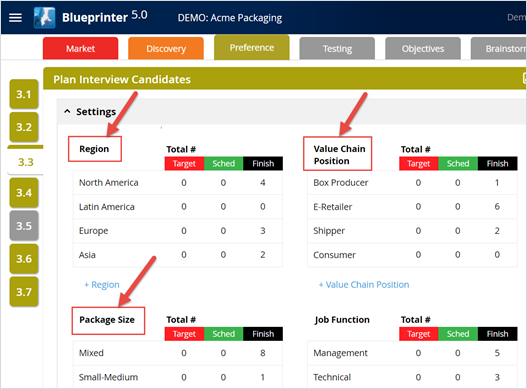
Your Blueprinter software lets you carefully examine possible sub-segments by creating a Market View for each in Tool 3.6: Analyze Preference Data. This is only possible because you anticipated possible market sub-segments earlier. Remember the “Settings” section in Tool 3.3: Plan Interview Candidates? That’s where you entered “Region” and “Value Chain Position” descriptors, which you then assigned to each of your interview candidates. You also had an optional “Other” category you could use. In our example, “Other” was changed to “Package Size”…
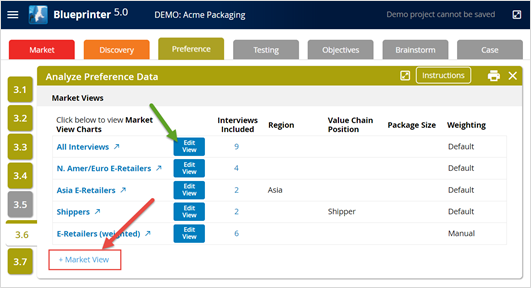
You can now create as many Market Views as you like in Tool 3.6: Analyze Preference Data. You’ll see the “All Interviews” Market View is automatically created for you. (Make sure this doesn’t contain your practice interview results.) To create a new Market View, just click “+Market View” (red arrow below). You can make changes to your Market Views any time by clicking “Edit View” (green arrow below.)
When you click “Edit View,” you’ll see you have lots of choices. You can…
- Use drop-down menus to select interviews satisfying certain descriptors (red boxes below)
- Give a name to your Market View (green box below)
- Manually click an interview to include it in this Market View (green arrow below)
- Accept default weightings (blue arrow below)
- Assign a weighting of your choosing to override the default (red arrow)
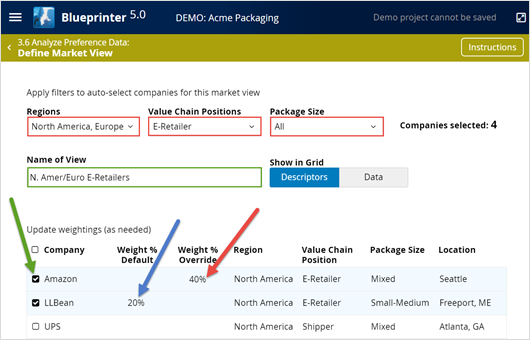
Initially the software will assign equal weightings. So each of four interviews would be weighted at 25%. But if one company has greater buying power, it’s a good idea to weight them heavier. If you weight Amazon at 40%, the other three interviews will automatically be reduced to 20% each.
The view we’ve been looking at so far is the “Descriptors” view. If you click the “Data” button next to the Descriptors button (red arrow below), you’ll see all the 1-to-10 importance and satisfaction ratings for each interview:
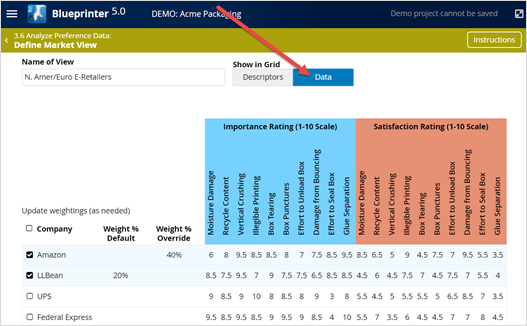
In the next article (Analyzing chart 1: IMP + SAT), you’ll use this data to understand which interviews are causing high standard deviations. That is, you’ll look to see which interviewed companies agree with each other—and belong in the same sub-segment—and which do not.
Once you’ve created your Market Views, you’ll analyze a set of 4 charts for each to learn more. It’s a good idea to start with your “All Interviews” Market View… or another view you’ve created that includes all the companies whose opinions matter to you. You’ll probably exclude Preference interviews with an industry consultant or a government regulator—and certainly any of your practice interviews—and just include companies who might purchase your new product eventually.
One last point: As you analyze your charts, you might gain new insights that lead you to a different way to sub-segment your market. You can create a new Market View at any point if it helps.
For more on analyzing Preference interview data, see e-Module 24: Preference Interviews B, at www.blueprintingcenter.com > e-Learning. For research on how AIM clients conduct Preference interviews, download Preference Interview Research Report.
Also, to better understand the importance of making data-driven decisions in new product development, check out this 2-minute video in the B2B Organic Growth video series by Dan Adams.

Keywords: Blueprinter 3.6: Analyze Preference Data, Blueprinter 3.3: Plan Preference Interview, Market View, market sub-segment, analyze Preference interview data, sub-segment by region, sub-segment by point in value chain, sub-segment by business model, analyze Market View charts, Descriptors view, Data view