The best strategic plans operate at two different levels. The business level speaks to what the entire enterprise will become. It addresses the capabilities that must be built that apply to all market segments. As you can imagine, this might include regional manufacturing infrastructure, employee skill-building, supply chain matters, and more.
The second level addresses the market segments the business will give its highest priority to pursuing. A market segment is a “cluster of customers with similar needs.” (See BlueHelp article, How to segment markets.) Proper market segmentation is just the first step. The second is deciding which you will disproportionately allocate your resources to pursuing.
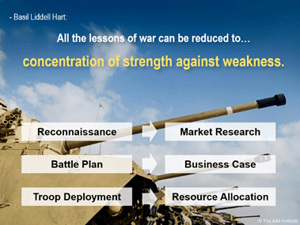 This follows the main lesson of warfare: Concentration of force against weakness. The winning general concentrates his troops at the enemy’s weakness point. The losing general tries to attack up and down the entire front line. Sadly, many businesses miss this lesson and try to pursue all market segments with equal vigor. Here’s the parallel:
- Your market research is the business version of reconnaissance
- Your business case is the business form of a battle plan
- Your resource allocation is the business counterpart of deploying troops
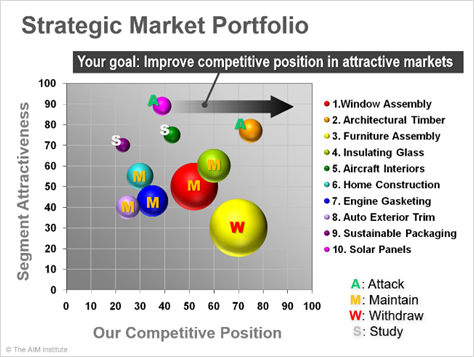
So how do you select the market segments you will target? A good approach is to build a GE-McKinsey matrix as shown here, with a bubble representing each market segment you are considering. Some use a nine-box matrix for this, but we prefer to assign values for the components of each access.
How would you assign levels of segment attractiveness and your competitive position? One approach is to develop a composite scoring system based on several weighted components. Here’s an example:
Segment Attractiveness (with weightings)
- Industry growth rate (30%)
- Industry profitability (20%)
- Bargaining power with suppliers (5%)
- Bargaining power with customers (5%)
- Rivalry intensity within industry (10%)
- Barriers to entry from outside (10%)
- Potential of substitute products (10%)
- Other, e.g. cyclicality, unmet needs… (10%)
Our Competitive Position (with weightings)
- Relative size (30%)
- Relative profitability (20%)
- Unique offerings (10%)
- Protected technology (10%)
- Product breadth (10%)
- Cost structure (10%)
- Other, e.g. knowledge, reputation… (10%)
The business team should work together to assign values and create the GE-McKinsey portfolio chart shown. Then assign one of four strategies to each market: Attack, Maintain, Withdraw or Study. Be careful the team doesn’t try to attack everything at once. Remember: concentration of force against weakness.
For more on this topic, check out the 2-minute video, Concentrate on winning markets, part of the B2B Organic Growth video series by Dan Adams.

Keywords: market concentration, strategic market portfolio, strategy, GE-McKinsey portfolio, segment attractiveness, competitive position, cluster of customers