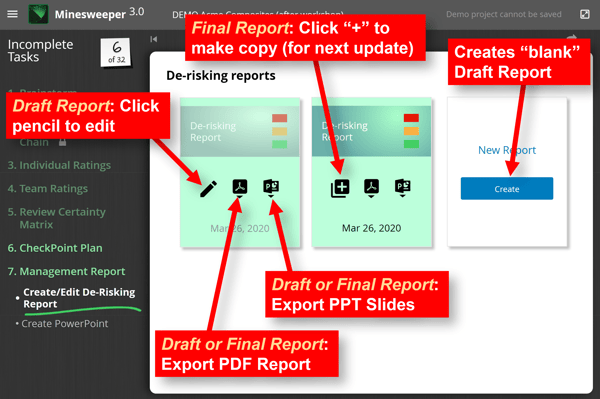
As explained in the last article, it’s easy to generate a new “Final” PDF report for management every time you give them an update. When you go to Step 7: Management Report > Create/Edit De-risking Report, you have 5 options:
- Edit your report: You can only do this with a Draft Report, not the Final Report (by clicking the pencil icon).
- Export a 2-page PDF report: You can do this with either a Draft or Final Report.
- Export a 6-slide PPT deck: You can do this with either a Draft or Final Report.
- Make a copy: You can only do this with a Final Report, not a Draft Report (by clicking the “+” sign). This is recommended for creating your next update, since the Draft generated retains all the information you’ve captured so far.
- Make a new report: This generates a new “blank” Draft Report. Unlike “Make a copy” (point #4 above), all the fields will be blank.
In addition, you can click “Create PowerPoint” in the left side-bar under Step 7: Management Report for more presentation options. When you do, you’ll see you have many options for the slides you can create, as shown below.
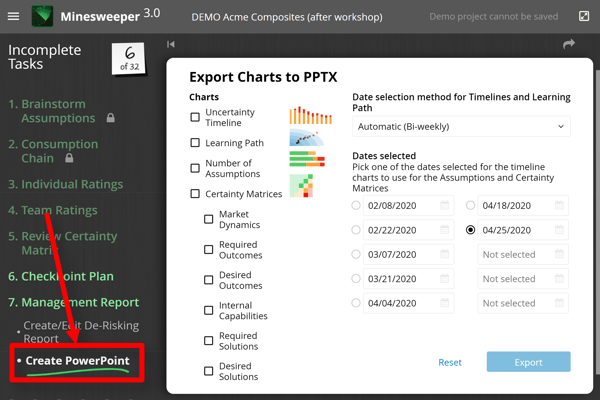
What’s the difference between these PowerPoint slides and those generated when you click PPT icon on a Report in the prior step ("Create/Edit De-risking Report")? The earlier Draft or Final Report PowerPoint slides are designed for high-level discussions, and include descriptive paragraphs (e.g. Summary, Status and Recommendations). Plan on using the 6 Report-based slides for all your management reviews.
But it's wise to create more PowerPoint slides using the “Create PowerPoint” function for a) backup slides or b) if you want to discuss something in more depth. For instance, this function lets you display all 6 of the Certainty Matrices. So if you want to go into more detail on key assumptions, you should generate these slides.
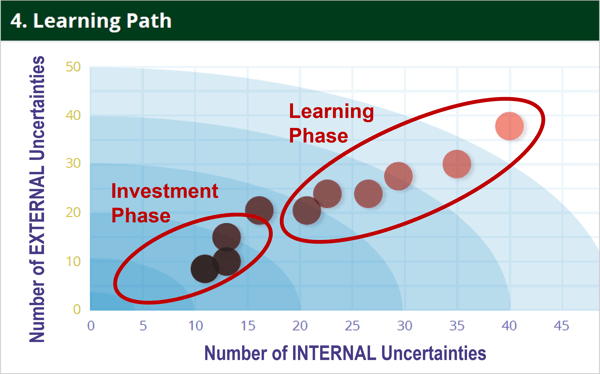
A final recommendation for your management presentations. Be very clear when you are simply updating management on your learning progress… and when you are asking them to make investment decisions. For most projects, you’ll spend a good bit of time in this learning phase before major investment decisions are needed.
Try to avoid discussions of risk, NPV (net present value) and probability of success in the Learning phase. It’s too early for that: You are simply driving out uncertainty and you are doing it rapidly and cheaply. The Learning Path chart gives you a good opportunity to make this point with management. As shown in the illustration below, you are just giving them updates in the early phases of the project. Later—after you have cleared out most of the uncertainties—you’ll be back to talk about investment decisions.
For more, check out the 2-minute video, How to manage transformational projects, part of the B2B Organic Growth video series by Dan Adams.
Keywords: Progress reports, management reports, PDF de-risking report, PowerPoint slides, PowerPoint options, New Report, Draft Report, Final Report, update management, learning phase, decision phase, investment decisions, NPV, net present value, probability of success, risk, Learning Path chart