- BLUE HELP
- Blueprinter® Software
- Blueprinter Updates
-
Blueprinting Center & Methodology
- What is New Product Blueprinting?
- How is Blueprinting learned and applied?
- Blueprinting Center
- Blueprinting E-Learning Course
- How can I become Certified in New Product Blueprinting?
- How does Blueprinting fit with a stage-and-gate process?
- How does Blueprinting fit with strategic planning?
- How does Blueprinting fit with Design Thinking?
- How does Blueprinting fit with Lean Startup?
- How does Blueprinting fit with Minesweeper de-risking?
- How does Blueprinting fit with LaunchStar product launch?
- What innovation metrics should we use?
- What is "Jobs-to-be-Done?"
-
Blueprinter® Software
-
Market Segmentation (Step 1)
-
Discovery Interviews (Step 2)
- How to plan Discovery interviews
- Preparing your interview team
- Convincing customers to be interviewed
- How to handle confidential info in an interview
- How to conduct a Discovery interview
- Finding & using a digital projector for interviews
- How to conduct a customer tour
- How to debrief & follow-up a Discovery interview
- Engaging your sales colleagues in interviews
- Engaging distributors in interviews
- Interviewing customers down the value chain
- How to interview remotely with web-conferences
- How to interview at trade shows & other venues
- Interviewing in different global cultures & languages
- How to listen well during customer interviews
- How to probe during customer interviews
- How to gather economic data during interviews
- How to create & use Current State questions
- How to identify Must Haves (MH)
- How to select Top Picks (TP)
- How to use Trigger Maps
- How to form Outcome Statements
-
Preference Interviews (Step 3)
-
Rest of Blueprinting (Steps 4-7)
-
Everyday VOC
-
Minesweeper® De-risking
BLUEPRINTER® SOFTWARE UPDATE – APRIL 23, 2023
Monitor the progress of Blueprinting projects with greater detail with the Market Case Quality tab.
Innovation leaders can now monitor the progress of Blueprinting projects with the new "Market Case Quality tab" within the Executive Dashboard.
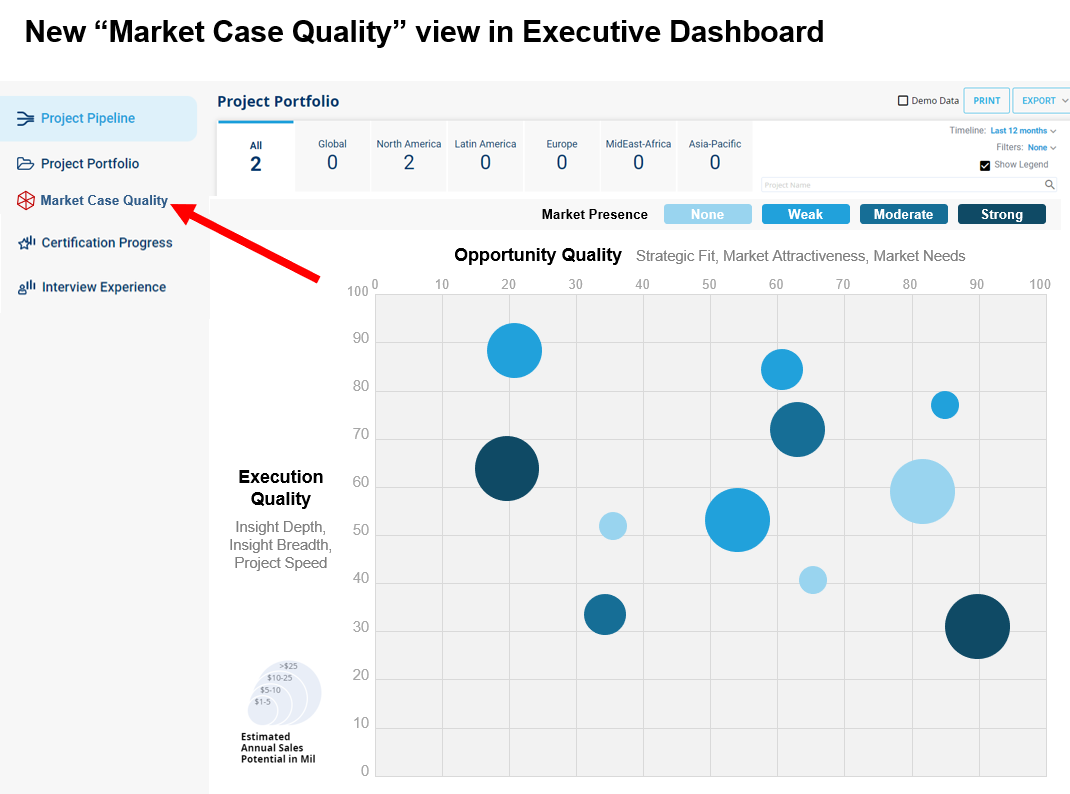
Leaders can observe a portfolio of completed market cases. The size of each bubble represents the size of the potential financial opportunity. The color of each bubble represents the degree that there's a current presence within a market.
They can track the Opportunity Quality as we as the Execution Quality of a Market Case.
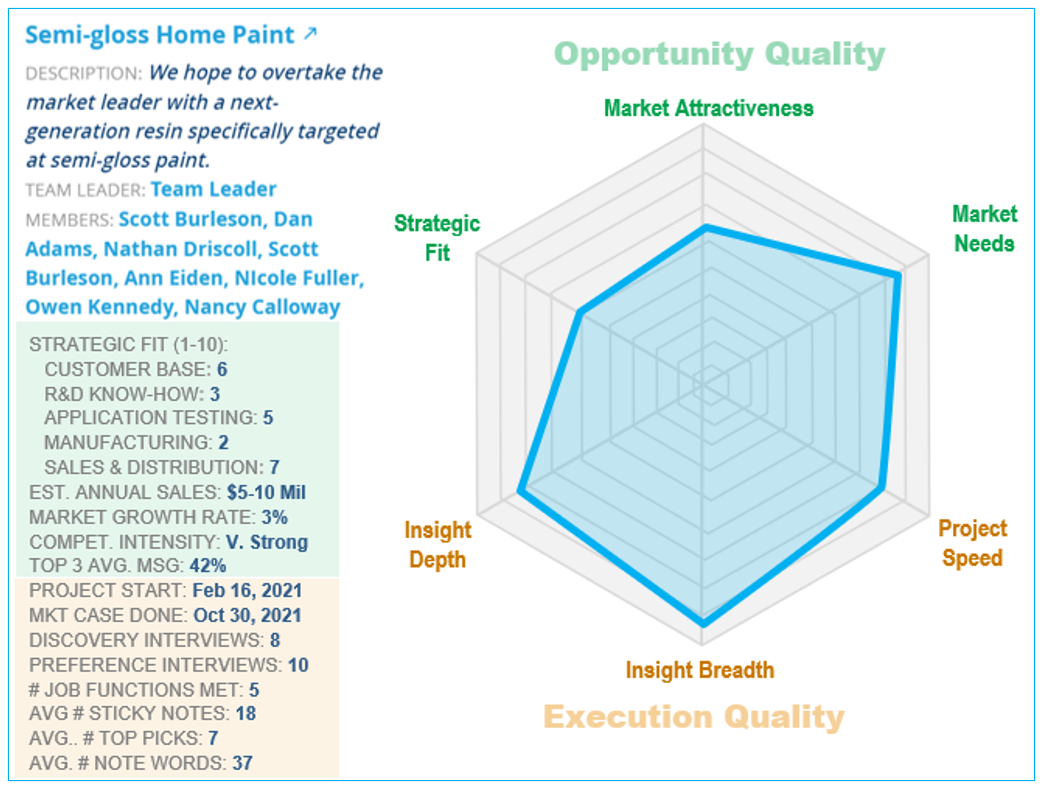
The "Opportunity Quality" represents the strength of an opportunity, in that it has an attractive set of unmet customer needs to pursue and fits well with company strategy.
"Execution Quality" represents how well the Blueprinting project was executed. It's calculated using algorithms within Blueprinter that measure how much insight was uncovered and how quickly the project was completed.
To see what data is driving each score for Opportunity Quality and Execution Quality, just click on one of the bubbles. This will reveal a radar chart containing additional details:
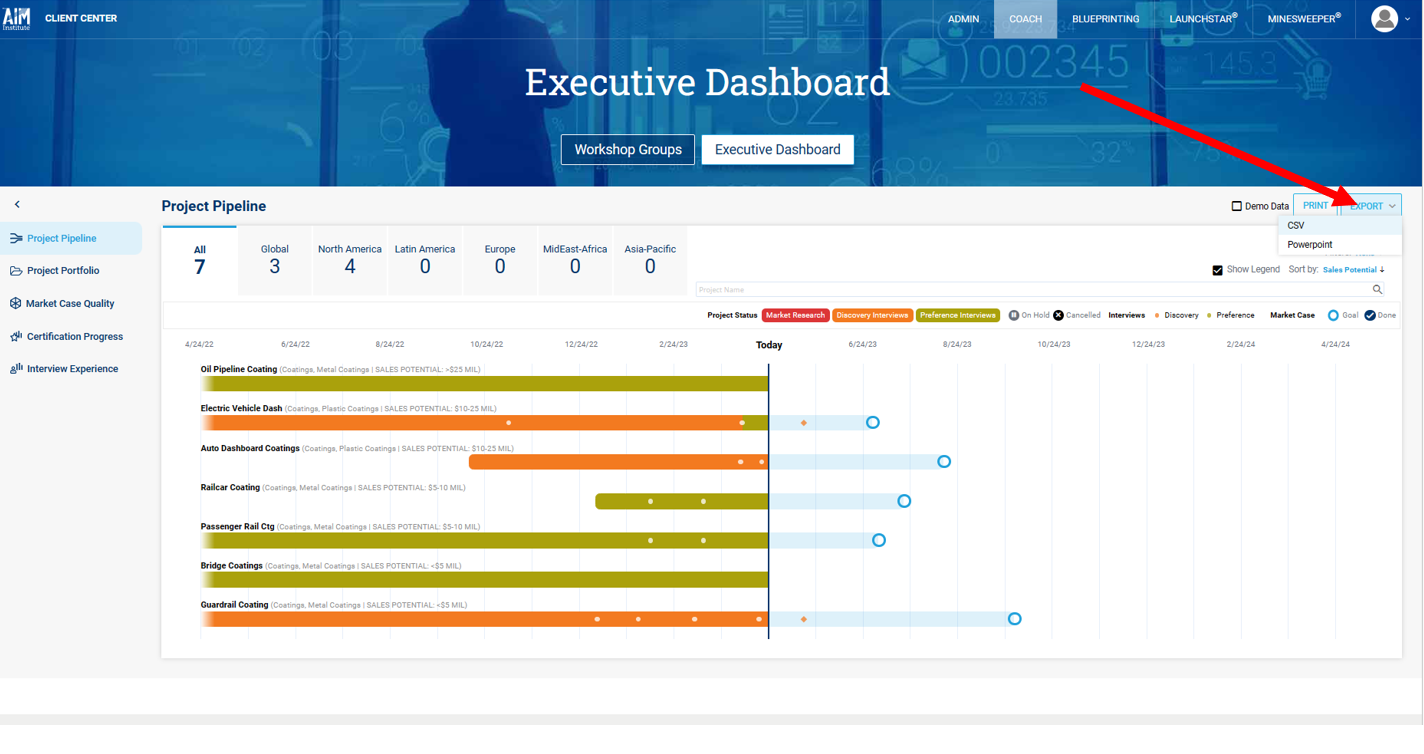
Additionally, data for Opportunity Quality and Execution Quality can be exported in either PowerPoint or CSV form with the Export button in the upper right.